For real estate agents & loan officers

Rent vs Buy &
Home Purchase Analysis

Run the numbers with your client, compare up to three homes and four loan options side by side, and print a client report in your brand — with your name, logo and photos.

💻 Web app — desktop & Android 📱 Web app — iPhone & iPad 📊 Excel workbook
Net-worth break-even
Year 8
Cash needed upfront
$87,300
Difference · Year 10
Buy +$27.2K
Rent vs Buy & Home Purchase Analysis · demo

Sample scenario — a 3-bed home in Austin, TX. Every value can be changed to your client's numbers.

Conventional · FHA · VA · USDAPMI end dateARM scenarioRate buydownsRefinance what-ifRental conversionFederal tax benefitCapital gains on saleDebt-to-incomePrice × rate gridBuy now vs waitWhat matters mostYear-by-year tableBranded report
How it works

Set up once. Then three steps per client.

Your details, logo and local market numbers stay with the tool, so each new client starts from your own template.

01

Set up your tool — once

Add your name, brokerage, license or NMLS ID, logo and photo. Save market presets with your area's rates, taxes and rents.

🧑‍💼 Agent
02

Run each client's numbers

Enter the client's details and budget, apply your preset and calculate. Add homes or loan options, and try what-ifs live.

👤 Client🏠 Analysis⚖️ Compare🏦 Loans🎛 Live
03

Print the client report

Tick the blocks to include, add your notes, then Print / Save as PDF — with your branding on the report.

📄 Report
Inside the tool

Seven tabs, built around your client meetings.

The same seven tabs as in the tool. Tap ƒ beside any result to see how it's calculated, and type over any value.

One home — buying vs renting + investing

Enter the home, the loan and the rent, or apply one of your market presets, then press Calculate.

  • Projected net worth on both paths and the net-worth break-even year
  • Monthly cost line by line, cash needed upfront and a debt-to-income estimate
  • Mortgage over time, ways to lower the payment and a price × rate grid
  • If the home is sold, rented out later, bought after waiting, or refinanced
  • What matters most — key variables ranked by impact
Sections on this tab
InputsResultsMonthlyCashDTIMortgagePayment optionsPrice × rateNet worthYear by yearSaleRent outWaitRefinanceWhat matters
Tap a picture to see it full size.

Try what-ifs during the meeting

Move a slider and the results update right away, next to the Analysis numbers — the Analysis inputs stay as they are.

  • Sliders for home price, mortgage rate, loan term, down payment, rent, appreciation, return and time horizon
  • More sliders for taxes, insurance, HOA, closing and selling costs, points and seller credit
  • Every result shows its change against the Analysis scenario
  • Reset, or apply the new values to Analysis with one click
  • Add the session to the client report as its own section
Tap a picture to see it full size.

Renting vs up to three homes

One column per home, rows aligned. Copy the loan and costs from Analysis, then change only what differs — a blank cell uses the Analysis value.

  • Cash upfront, monthly cost and projected net worth for every home
  • Net worth over time for renting and each home on one chart
  • What moves the break-even year for each home
  • Property details and photos for each home, for the report
  • Copy the comparison to Excel or Google Sheets with its formulas
Tap a picture to see it full size.

Up to four loan options for the same home

Enter the rate the lender quotes for each option — 30-year or 15-year fixed, with points, ARM or buydown — and read the differences straight across.

  • Conventional, FHA, VA and USDA, each with its own mortgage insurance and fees
  • Monthly housing cost, cash at closing and total paid to Year 10 or over the loan
  • Loan balance and cost of borrowing over time
  • Discount points, seller credit and temporary buydowns
  • Copy the loan comparison to Excel with its formulas
Tap a picture to see it full size.

Your client's details and budget

Who the report is for and what they plan to spend. Tick “Show on report” for each detail that should appear.

  • Client and co-buyer names, phone, email, address and notes
  • Cash available and the monthly payment they're comfortable with
  • Gross monthly income and other debt payments
  • Linked to cash needed upfront, debt-to-income and ways to lower the payment
  • Save each client to the client roster in your browser
Tap a picture to see it full size.

Set up once, use for every client

Choose who is using the tool — real estate agent, loan officer, or an agent & loan officer team — and the report's default disclaimer follows.

  • Name, title, brokerage, license, NMLS ID, contact details, logo and photo
  • Market presets with your local numbers — apply one for each new client
  • Program & tax rules pre-filled for 2026, ready to update when HUD, VA, USDA or the IRS change them
  • Report footer and an optional Equal Housing Opportunity line
  • “Save as New File” keeps it all as your own blank template
Tap a picture to see it full size.

Pick the blocks, print the report

Tick the blocks to include, add your notes, then Print / Save as PDF. Your details and logo sit at the top.

  • At a glance, monthly cost, cash upfront, net worth, mortgage and year by year
  • If the home is sold, buying now vs waiting and what matters most
  • Live what-if, loan options and the comparison of homes
  • Property photos, details and your own highlights
  • Your notes with formatting, and a disclaimer you can edit
Tap a picture to see it full size.
The client report

A branded report, ready to share.

Everything from the meeting in one document — with your name and logo at the top. Print it or save it as a PDF.
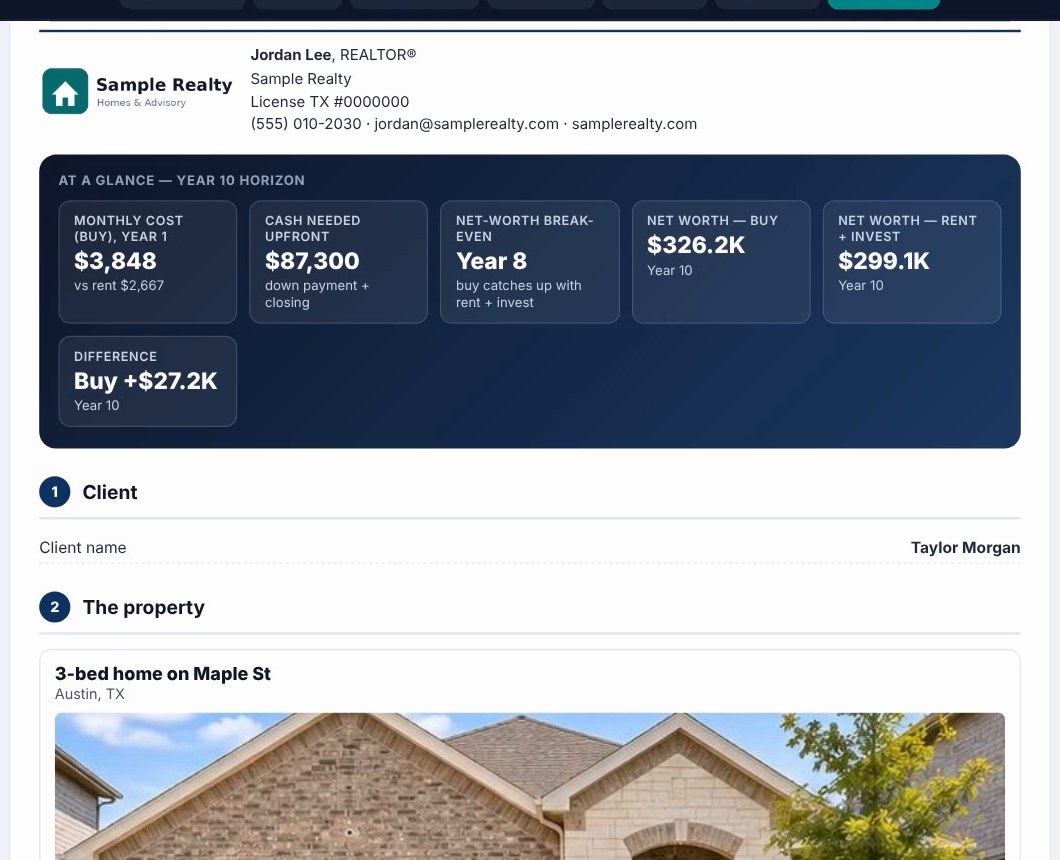
Client report — agent details and At a glance numbers
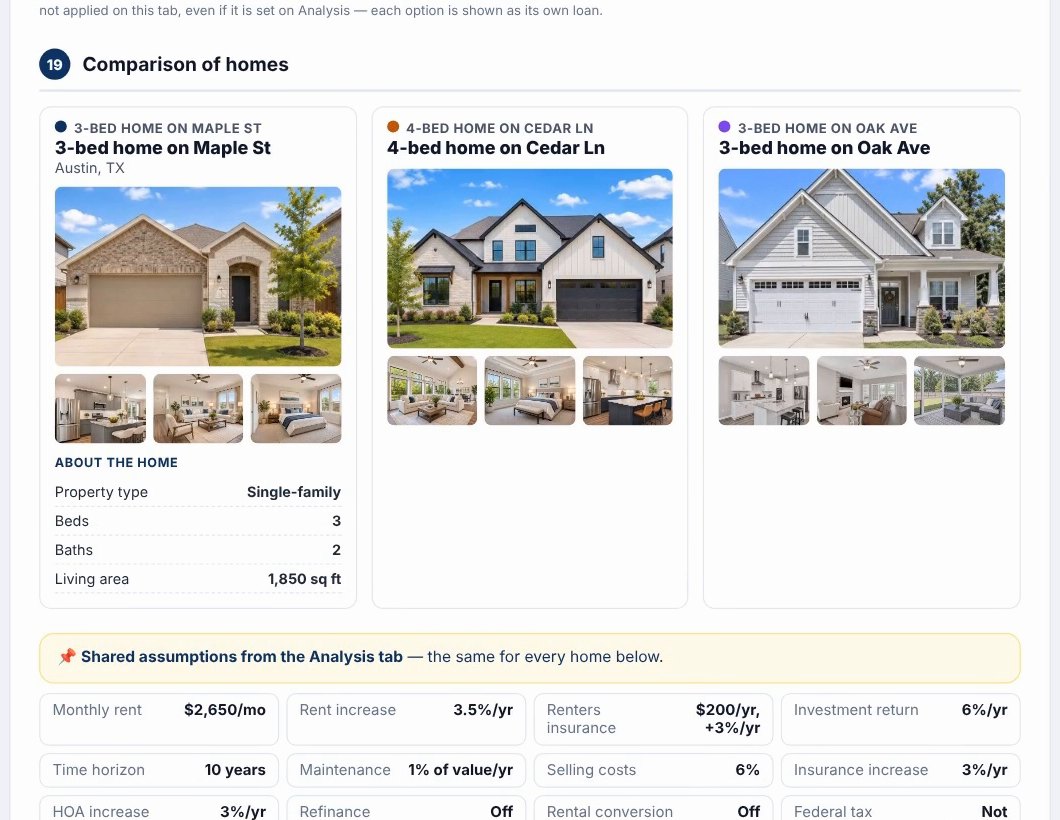
Client report — comparison of homes with photos
🖨️ Print / Save as PDF
🏷️

Your branding

Name, title, brokerage, license or NMLS ID, contact details, logo and photo.

☑️

Pick the blocks

At a glance, monthly cost, cash upfront, net worth, loan options, home comparison, live what-if and more — all ticked by default.

🖼️

Property photos and details

Main photo, gallery, beds, baths, living area and your own highlights for each home.

📝

Your notes for the client

Formatted notes and images, plus a disclaimer you can edit, an optional Equal Housing Opportunity line and a footer on every page, first or last page.

What you get

One purchase. Three ways to use it.

Every version is the same calculator — the same inputs, results, charts and client report. Use whichever you prefer, and keep all three.
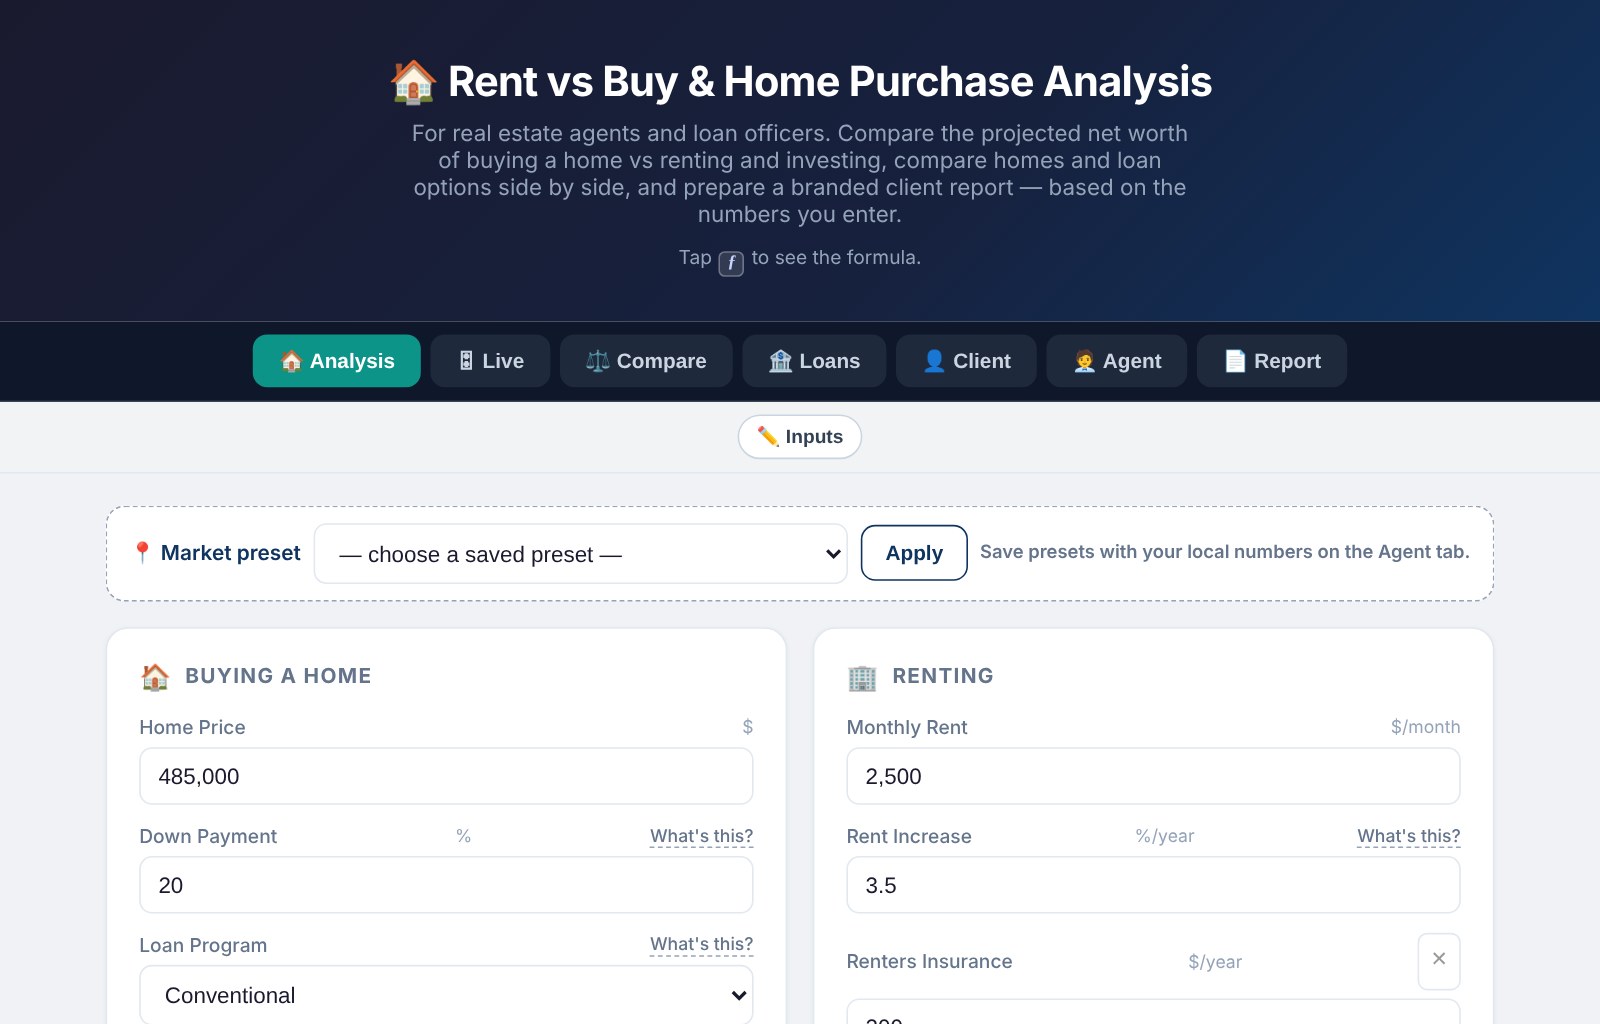
Web app on a computer
Web app

💻 Desktop & Android

  • Open your link in Chrome or Edge, or install it on your computer or Android phone
  • “Save as New File” keeps your details, logo and presets as your own blank template
  • Client details and photos are saved inside each file you keep
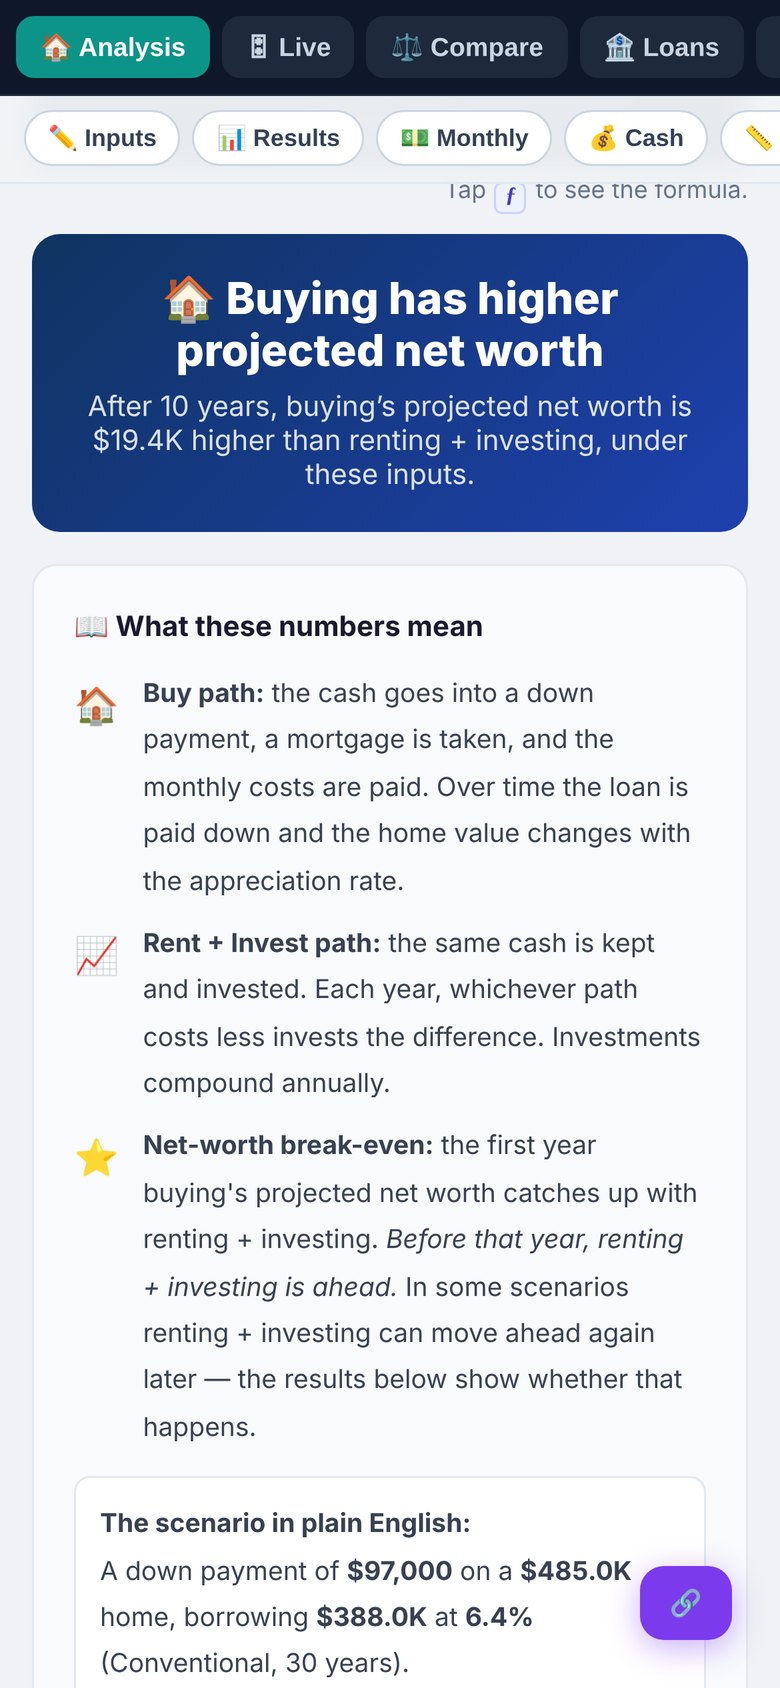
Web app on an iPhone
Web app

📱 iPhone & iPad

  • Open it in Safari and add it to your Home Screen
  • “Share URL” keeps your details, presets and program values as a link — your template for new clients
  • The same seven tabs and the same client report
Excel workbook

📊 Excel workbook (.xlsx)

  • Every result is a live formula — change a blue cell and everything recalculates
  • Client & Agent details and a Report sheet to print or save as PDF
AnalysisResultsYear-by-YearCompare & LoansClient & AgentReport
The details

The details clients ask about, already built in.

🏛️

Loan programs

Conventional, FHA, VA and USDA — mortgage insurance, funding and guarantee fees, loan limits.

📉

PMI end date

Standard (78% of original value) or early cancellation on request, checked month by month.

🔄

ARM & buydowns

Simplified ARM scenario, 1-0, 2-1 and 3-2-1 temporary buydowns paid by seller or buyer.

🔁

Refinance what-if

A future refinance at a rate you assume, with costs paid in cash or added to the loan.

🏘️

Rental conversion

Move out and rent the home — vacancy, management, depreciation and recapture on a sale.

🧾

Federal tax benefit

Itemizing vs the standard deduction, with the SALT limit and the mortgage debt limit.

🏁

Sale & capital gains

Cash from a sale, the home-sale exclusion for single or married filers, and a next-home price.

⏳

Buy now vs wait

Wait a few years at a different rate and price — cash upfront and monthly cost side by side.

See how every number is calculated

Useful when a client asks “where does that come from?”

  • Tap ƒ next to a result, table column or chart line for the formula, step by step
  • Copy the year-by-year table to Excel or Google Sheets with its formulas
  • Every value can be edited by hand, including the pre-filled figures

Client data stays on your device

The calculators run in your browser. Inputs, client details and photos are not sent to a server.

  • Logo and photos are stored inside your own file
  • The client roster is saved in your browser only
  • No account to create
Built to use for years

The numbers change. Your tool keeps up.

Buy once and keep using it as rates, rules and costs change — in the web apps and the Excel workbook alike.

✏️

Change any pre-filled value

Every value starts filled in — type over any of it: rates, costs, limits and tax figures.

🔄

When the numbers change, type the new ones

Loan program and tax values come pre-filled for 2026. When HUD, VA, USDA or the IRS update them, type the new figures under Program & tax rules on the Agent tab — no update needed.

🎯

Values are used as you type them

No hard caps — a note appears beside an input only if it's outside a logical limit.

Get the tool

Your branded rent vs buy & home purchase toolkit.

Buy once — both web apps and the Excel workbook are yours to keep.

$79one-time payment · instant access
  • 💻 Web app — desktop & Android ✓ Included
  • 📱 Web app — iPhone & iPad ✓ Included
  • 📊 Excel workbook (.xlsx) ✓ Included
Get the tool →

🔒 Secure checkout via Gumroad · Card or PayPal · Instant download

After checkout you receive the links to both web apps and the Excel workbook.

FAQ

Questions

Who is it for?

Real estate agents, loan officers, and agent & loan officer teams. You choose who is using it on the Agent tab, and the report's default disclaimer follows — you can still edit it on the Report tab.

Do my clients need to buy or install anything?

No. You run the numbers and share the report with your client as a printed copy or a PDF.

Can I use the numbers for my local market?

Yes. Save market presets with your area's rates, taxes, insurance and rents, and apply one for each new client. Every value can be typed over by hand.

What happens when loan program or tax values change?

Program and tax values come pre-filled for 2026. When HUD, VA, USDA or the IRS update them, type the new values under Program & tax rules on the Agent tab.

Is client data uploaded anywhere?

No. The calculators run in your browser and your inputs are not sent to a server. Client details and photos are kept in the file you save (on iPhone and iPad, in your link and on your device).

Is the Excel workbook the same as the web app?

Yes — the same inputs, calculations, charts and client report, as live formulas you can open in Microsoft Excel. Both versions are yours to keep.

Which devices does it work on?

The desktop & Android web app works in Chrome or Edge on a computer or Android phone. The iPhone & iPad web app works in Safari. The Excel workbook opens in Microsoft Excel.